The Agent Readiness dashboard provides a centralized view of your organization’s readiness scores across all repositories, with historical trends and detailed breakdowns.
Accessing the Dashboard
Navigate to Settings → Analytics → Agent Readiness in the Factory App.
Main Dashboard View
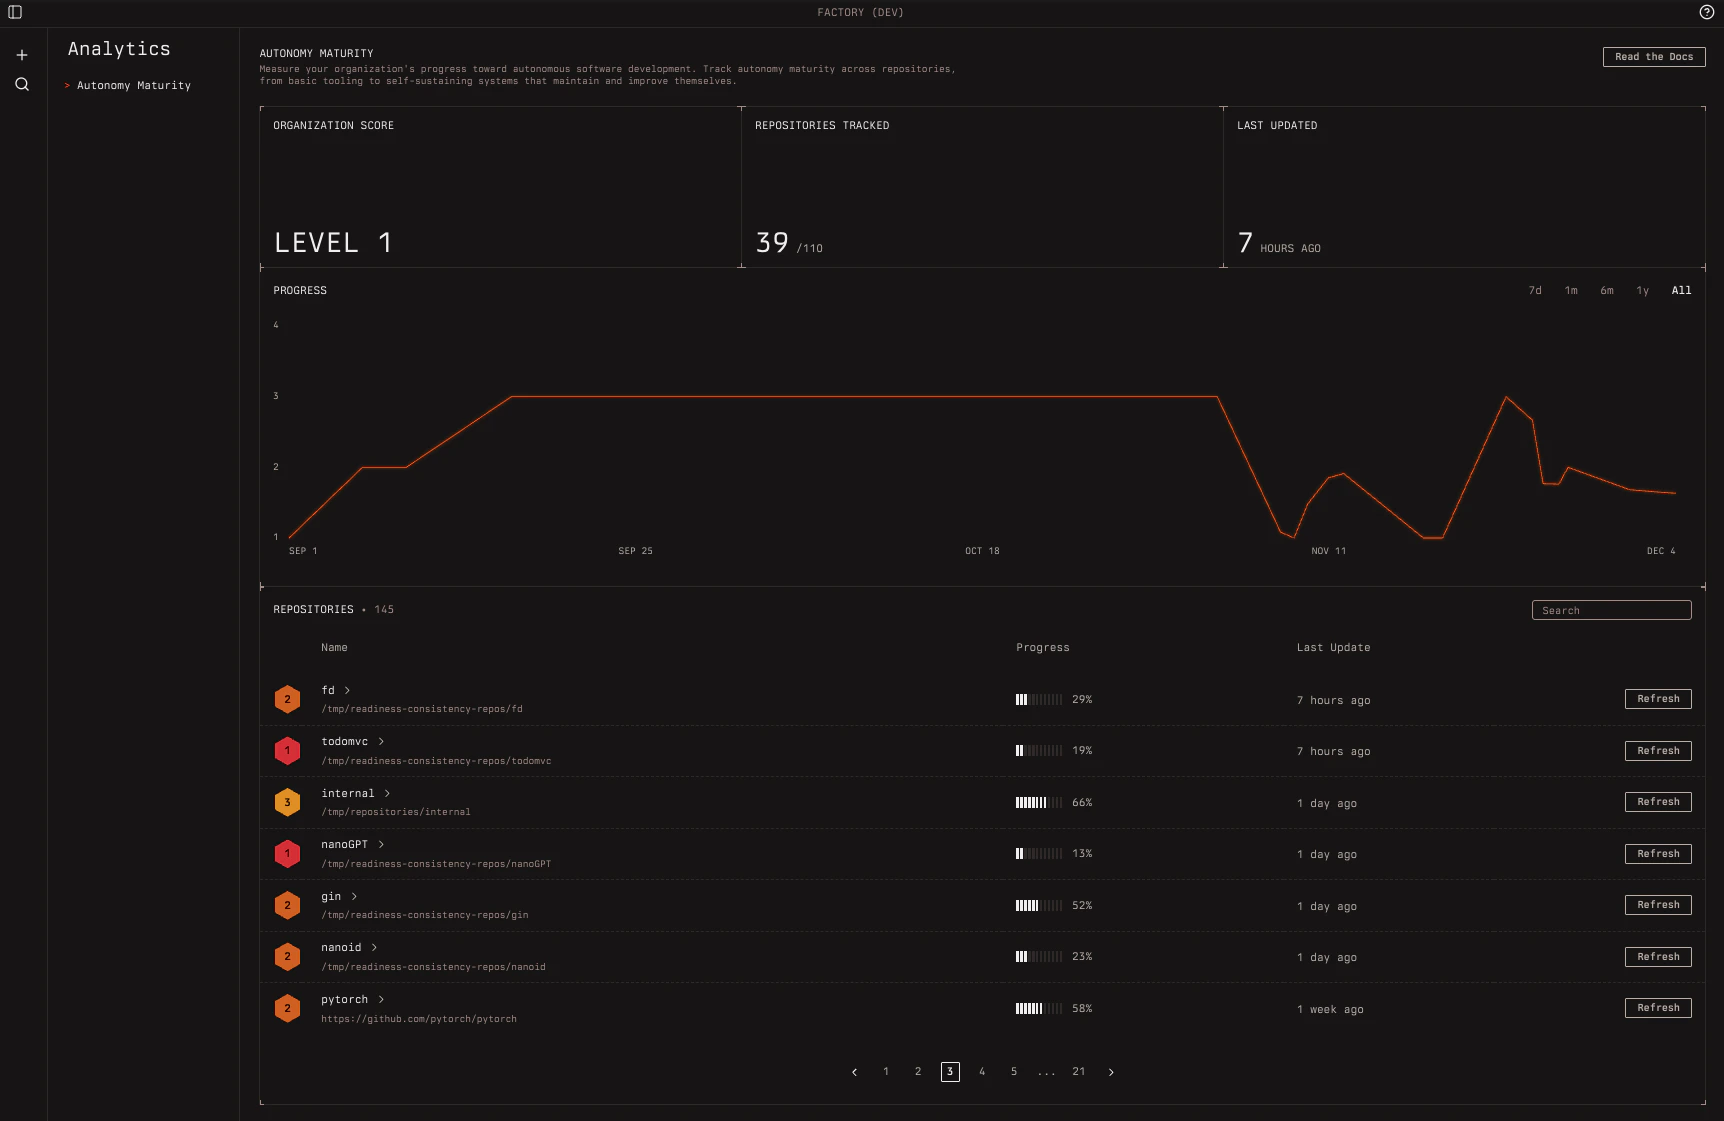
The dashboard shows an organization-level overview with three main sections:
Summary Cards
At the top, you’ll see key metrics:
| Metric | Description |
|---|
| Organization Score | Average readiness level across all measured repositories (rounded down) |
| Repositories Tracked | Number of repositories with readiness reports vs. total enabled repositories |
| Last Updated | Time since the most recent readiness evaluation |
Progress Graph
A time-series chart showing your organization’s readiness level over time. Use the period filters to view different time ranges:
- 7d — Last 7 days
- 1m — Last month
- 6m — Last 6 months
- 1y — Last year
- all — All time
Repositories Table
A searchable, paginated table of all repositories showing:
- Repository name — Click to view details
- Level — Current readiness level (1-5)
- Progress — Percentage complete toward next level
- Last Update — When the repository was last evaluated
Use the search bar to filter repositories by name or URL.
Repository Detail Page
Click any repository row to view its detailed readiness breakdown.
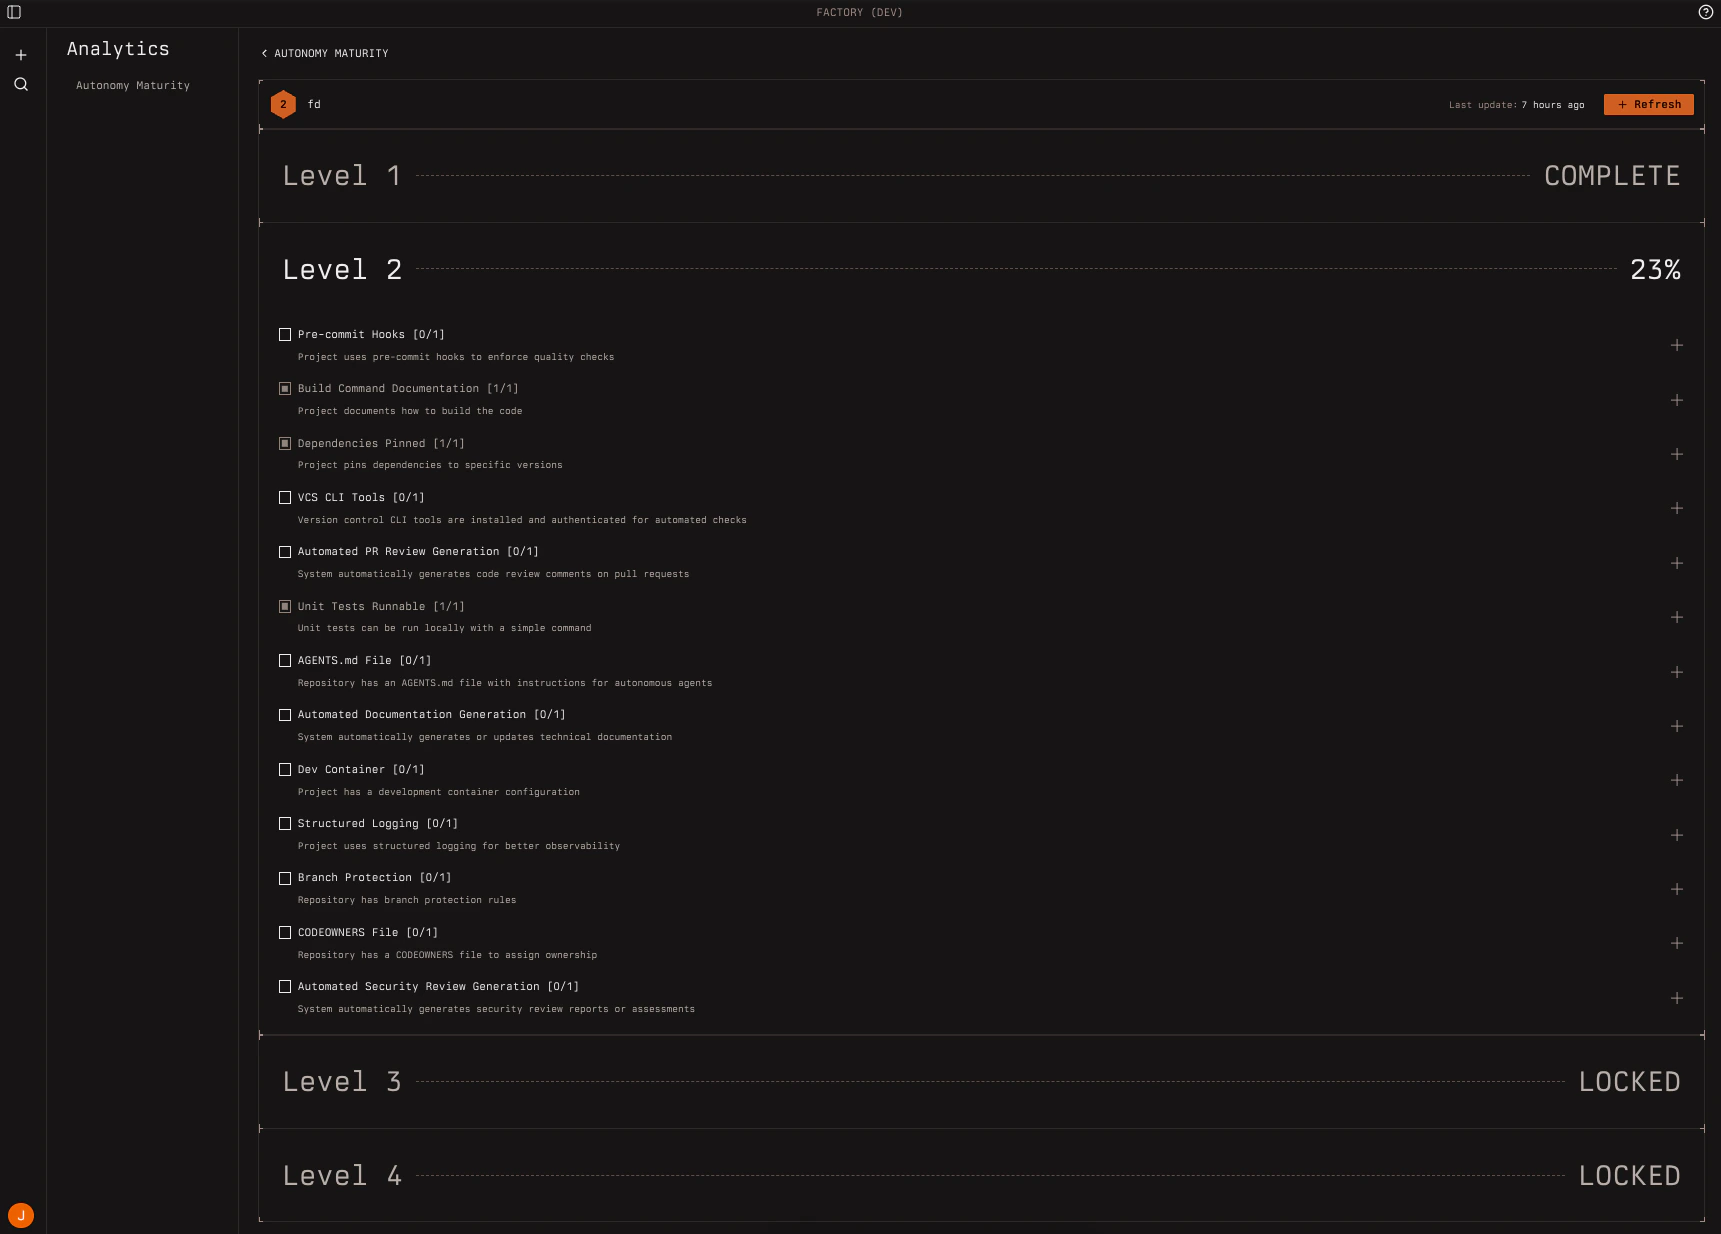 Shows the repository name, current level achieved, last evaluation time, and a Refresh button to trigger a new evaluation.
Level Accordions
Each readiness level (Functional through Autonomous) has an expandable accordion section showing:
- Percentage complete — How much of that level’s criteria are passing
- Lock status — Levels are locked until the previous level reaches 80%
Criterion Rows
Within each level, individual criteria display:
| Element | Description |
|---|
| Name | The criterion being evaluated |
| Score | Format [X/Y] — numerator/denominator |
| Status | Pass (green) or fail (red) indicator |
| Rationale | Click to expand and see the evaluation explanation |
Triggering a Refresh
There are two ways to refresh a readiness evaluation:
From the Factory App dashboard
- Navigate to the repository detail page
- Click the Refresh button in the header
- A new session starts to evaluate the repository
- Once done, the dashboard will update with results from the latest report
From the Droid CLI
Run the /readiness-report slash command in the Droid CLI while in the repository directory:
droid
> /readiness-report
Re-evaluations run the full readiness assessment against the current state of
your repository. This is useful after making infrastructure improvements or
merging changes that can affect a readiness criterion.
Understanding the Metrics
Organization Level Calculation
The organization-level score is calculated as the average of all repository levels, rounded down. For example:
- Repo A: Level 3
- Repo B: Level 2
- Repo C: Level 3
Organization Level = floor((3 + 2 + 3) / 3) = floor(2.67) = Level 2
Repository Level Calculation
A repository’s level is determined by the 80% threshold system:
- Start at Level 1
- If 80% of Level 1 criteria pass → achieve Level 2
- If 80% of Level 2 criteria pass → achieve Level 3
- Continue through Level 5
The percentage shown for each level indicates progress toward completing that level’s criteria.
Best Practices
- Regular evaluations: Run readiness reports after significant infrastructure changes
- Focus on current level: Address failing criteria in your current level before jumping ahead to focus on foundational improvements first
- Track trends: Use the progress graph to monitor improvement over time
- Prioritize high-impact fixes: The action items in CLI reports highlight the most impactful improvements